I’m heading to a conference (the Human Pangenome Reference Consortium’s 2025 meeting) and, through accident or luck, I have my fingers in three things: I’m speaking for part of one talk, giving a few plots to another, and presenting my own poster. This meant that I needed to get a lot of custom figures ready. And quickly. A script I wrote some time ago which produces plots based on a “config file” became a lifesaver to me. Figured I should write about it.
What d’yah mean, “config file”?
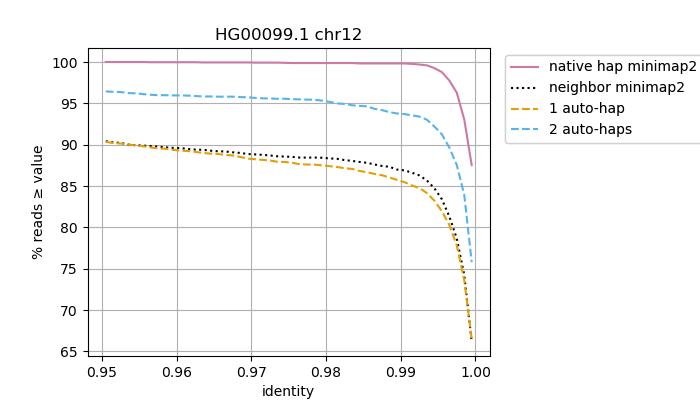
To answer that, I’ll back up a bit to explain what this script does. It makes line plots! Here’s an example:
Each line corresponds to a particular file’s data. I needed to make line plots comparing any group of files, and assign each file a specific label, line color, and line style.
My “config file” looked something like this:
/path/to/file1	0	-	native hap minimap2
/path/to/file2	1	:	neighbor minimap2
/path/to/file3	2	--	1 auto-hap minimap2
/path/to/file4	3	--	2 auto-haps minimap2
That is, it was the particular configuration of lines that I wanted to plot. Each line was specified by its data file, its color (the numbers corresponded to indexes into a color array), its line style in Matplotlib-speak, and its label.
What is this replacing?
There are two other methods I’ve used to get the same effect.
- Hardcoded values is the most obvious method. I could, for example, make a dictionary matching each file name to its line’s information. This has the obvious issue of working for only that specific plot. I would have to edit the source code between each plot just to reconfigure it.
- Command-line parameters would be way too wordy, especially when the number of lines increased. In addition, it would be more difficult to share the exact configuration of a particular run. I’d have to copy the entire command instead of just the config file.
I had to make a whole bunch of these plots. Each with slight variations (e.g. adding lines in piece by piece for a slide deck animation) and with the files stuffed in irregular locations due to differences in how they were generated.
That meant hardcoding was right out, and I didn’t feel like fighting with complicated parameters either. The config file was my middle ground. All I had to do was set up a config file and run with it. Usually these were even copied from previous configs, and I simply swapped out a few sample names in the file paths. lus, at the end, I simply shared my config files along with the code, so my coworker could trace where the original data came from.
Hopefully I’ve demonstrated the benefits I reaped from using config files to program a series of plots. I was able to whip out a whole bunch of bespoke plots in an afternoon.